I’ve always been a fan of spreadsheets. I’ve maintained tables of my spending for over a decade now, and, even before that, would regularly fire up Excel in order to arrange my thoughts or figures. Nowadays, I use spreadsheets for all sorts of different things, and, as this is perhaps not one might expect a lecturer in Restoration and Eighteenth-Century Literature to be doing, I thought a post on that topic might be in order.
First and most frequently, spreadsheets are a great way of managing data about people. I use spreadsheets for registers, to keep track of volunteers, to record marks, and for many other similar purposes. I don’t use them in a particularly sophisticated way: I can calculate my average mark, work out standard deviations, and use basic functions like SUM and COUNTIF, but the world of mail-merge, macros and other such mythical abilities is still beyond me. Having talked with staff who know more about Excel than I do, I should – apparently – also be reigning in my taste for creating tables.
The other main things I use spreadsheets for is module planning. A module last twelve weeks, which can seem both long and short. A way of getting my head round it is to tabulate it:
Let every row be a week (including assessment periods and holidays), and add a column for each aspect of that week’s teaching:
| Teaching Week | Title | Texts | Assessment 1 | Assessment 2 | Lecture | Lecture 2 | Blogs | Study Groups | Seminar Activity 1 | Seminar Activity 2 |
| 1 | |||||||||
| 2 | |||||||||
| 3 | |||||||||
| 4 | |||||||||
| 5 | |||||||||
| 6 | |||||||||
| 7 | |||||||||
| Easter Vacation | |||||||||
| 8 | |||||||||
| 9 | |||||||||
| 10 | |||||||||
| 11 | |||||||||
| 12 | |||||||||
Then start filling out the grid:
| Teaching Week | Title | Texts | Assessment 1 | Assessment 2 | Lecture | Lecture 2 | Blogs | Study Groups | Seminar Activity 1 | Seminar Activity 2 |
| 1 | Prologue | ||||||||
| 2 | Restoration Comedy | ||||||||
| 3 | Restoration Tragedy | ||||||||
| 4 | Anti-Theatre | ||||||||
| 5 | Performance Practices | ||||||||
| 6 | Humane Comedy | ||||||||
| 7 | She-Tragedy | ||||||||
| Easter Vacation | |||||||||
| 8 | Pantomime | ||||||||
| 9 | Sentimental Comedy | ||||||||
| 10 | Burlesque and Parody | ||||||||
| 11 | The Licensing Act | ||||||||
| 12 | Revision | ||||||||
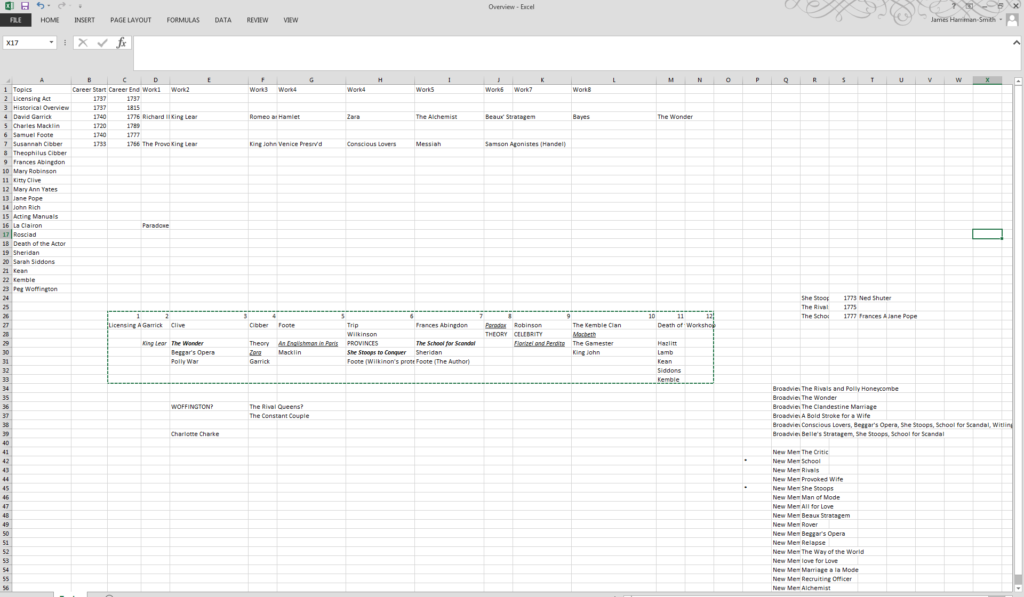
And so on. The rest of this spreadsheet will eventually become my third-year module, Between the Acts. Because I can’t stop planning modules (and because I like working within the clean lines of a spreadsheet), I’ve also started planning another third-year course, this time provisionally entitled The Age of the Actor. The spreadsheet looks like this:
| 1 | 2 | 3 | 4 | 5 | 6 | 7 | 8 | 9 | 10 | 11 | 12 |
| Licensing Act | Garrick | Clive | Cibber | Foote | Trip | Frances Abingdon | Paradox | Robinson | The Kemble Clan | Death of the Actor | Workshop |
| Wilkinson | THEORY | CELEBRITY | Macbeth | ||||||||
| King Lear | The Wonder | Theory | An Englishman in Paris | PROVINCES | The School for Scandal | Florizel and Perdita | The Gamester | Hazlitt | |||
| Beggar’s Opera | Zara | Macklin | She Stoops to Conquer | Sheridan | King John | Lamb | |||||
| Polly War | Garrick | Foote (Wilkinon’s protector) | Foote (The Author) | Kean | |||||||
| Siddons | |||||||||||
| Kemble |
This is nowhere near as neat, but, in a way is truer to my experience of spreadsheets. The full sheet is even more horrifying: I don’t recommend that anyone adopt exactly the same method as I am adopting here, where different areas of the sheet capture different parts of my planning process. I clearly began this document as an orderly summary of famous performers with career dates and notable productions; this then gave way to an impromptu, horizontal sketch of a 12-week module, with each row capturing an idea for the week’s topic, texts and themes; and then, in the bottom right, return to a table, this time summarizing what texts have sufficient editions available for me to set them as reading.
Hopefully that explanation made some sense of the screenshot. Hopefully, too, this module comes to a lecture theatre one day. But the real point of showing this is to suggest that there are more creative ways to use Excel than simply organizing data. I don’t want to say that these ways are good, or efficient, let alone correct (and my way of using the program is certainly partly down to ignorance), but I do want to say this in praise of spreadsheets: they are a creative canvas for me. Not unlike this blog.